In short
- The Infinity Platform brings website visits, phone calls, goals and channel data together in one place, so you can see how marketing performs online and offline.
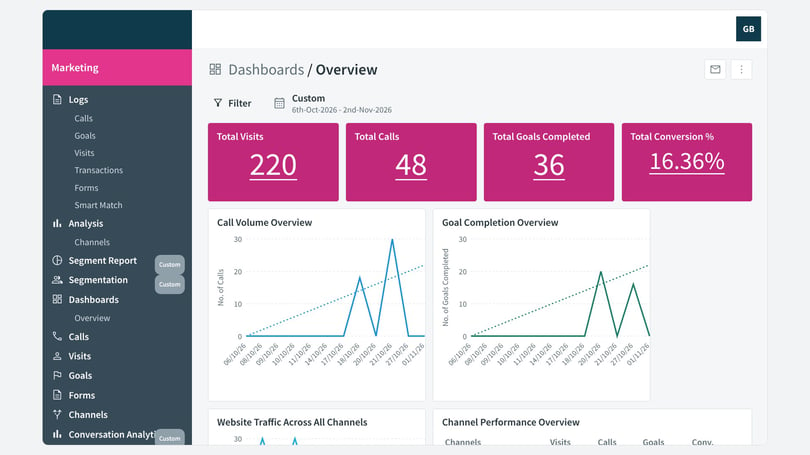
- The Infinity Platform dashboard overview, found under Dashboard in the left-hand navigation, shows visits, total calls, goal conversions and conversion percentage, and reports include complete days only.
- The Infinity calls log lists every call with its date, duration, caller ID, tracking pool, channel and goals, and the globe icon opens the visitor's full journey for calls from online sources.
- Infinity reports include Calls Overview, Call Quality, Call Distribution, Calls Acquisition, Goals Overview and Analysis: Channels, and any section can be exported or sent as a scheduled report from the mail icon.
- Manage an Infinity installation from Settings, including self-service fixed numbers, the tracking script, channels, goals and integrations.
The Infinity Platform is where you can see how your marketing is performing, both online and offline. It brings together your website visits, phone calls, goals and channel data in one place, so you can understand what is driving results and where to focus next. This overview takes you through the main reports, logs and features so you can get started with confidence.
Watch the Infinity Platform overview video
Watch this video to get familiar with the Infinity Platform.
Watch the video: Infinity Platform overview
Dashboard overview
The dashboard overview is the best place to start. You can find it by selecting Dashboard in the left-hand navigation.
The key event metrics appear across the top of the page. These show visits to your website, total calls to your tracking numbers, goal conversions, and the percentage of goal conversions against total visits. Below these metrics, graphs give you a top-down view of your data, so you can see how you are performing at a glance.
Filtering your data
You can select and apply date ranges at the top of the page, and filter your data by a range of parameters. This lets you go straight to the information that matters most to you, whether that is a specific period or a particular campaign.
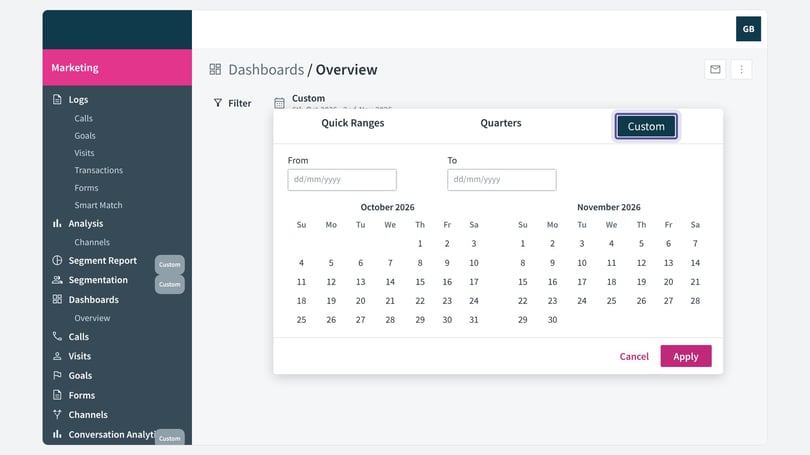
Reports include complete days only. For example, if you select the last 14 days, the range will cover the 14 days before today and will not include today's data. Quick ranges, quarters and custom ranges are all available.
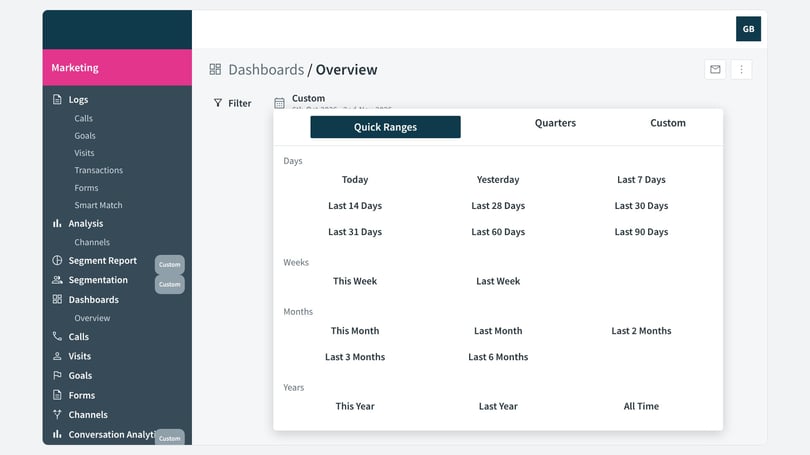
The date comparison feature lets you compare your current date range with a previous period or the same period last year. This helps you spot performance patterns over time.
Logs
While the dashboard overview is the best starting point for reporting, the logs show much more detailed data on cost, calls, goals and visits. If you use Smart Match or a CRM integration, the logs also include transaction data.
Smart Match has a new interface, larger file capacity and improved accuracy, and it can be set up quickly. Once connected, you can link transaction values and outcomes to calls in minutes.
Calls log
The calls log lists every call between a visitor and an operator within your selected date range. For each call, you can see the date and time, the call duration, the caller ID, the tracking pool the call came from, the marketing channel the call came through, and any goals linked to that type of call. Select the arrow on the left of an entry to see more detail about that call.
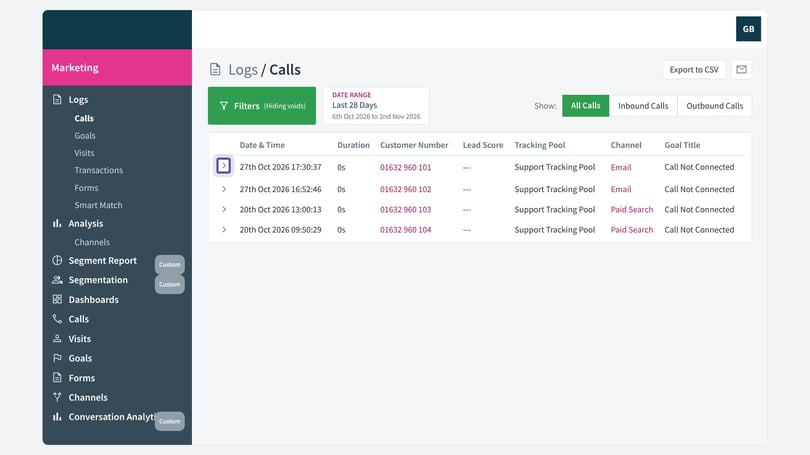
The call reports and logs help you connect online and offline visitor behaviour. You can use this data to review and improve your marketing and sales activity. To analyse any element further, you can export it to CSV.
Visitor journeys
The icons on the right-hand side of each call entry give you more context. The first shows the call details, including the time of the call, where the visitor came from and the tracking pool. Select the globe icon to see the visitor's full journey, from their first landing on your website through to the phone call.
A visitor trace is available when the visitor arrived from an online source, because we can track the online behaviour that led to the call. The trace shows the unique visitor ID, page views, calls, goals, and the first and last pages seen. You can follow the visitor's journey to see which parts of your website they visited and what interested them.
Filtering the calls log
You can use filters to narrow your data. For example, to see visitors who came from paid search, select Marketing Source / Channel, choose Paid Search and apply the filter. Your filters stay in place until you remove them. When you open a visitor trace from paid search, you will also see the campaign and keyword that brought them to your site.
You can also filter the calls log to show only calls where PPC played a part in the customer journey before the call. This is called PPC Assisted. It is a quick way to see the calls that PPC has driven, and these calls are marked with a dollar icon.
Reports and overviews
To see your call data as a summary, go to the Calls Overview section in the left-hand navigation. Here you can see calls by date, calls by tracking pool, and the hours of the day when you receive the most calls.
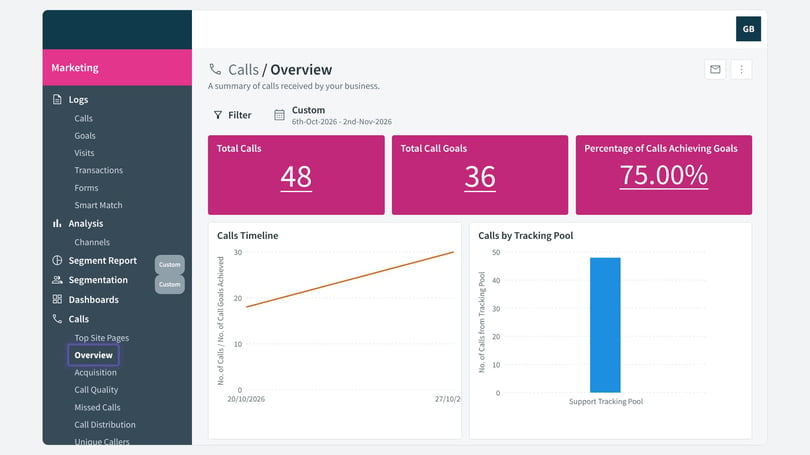
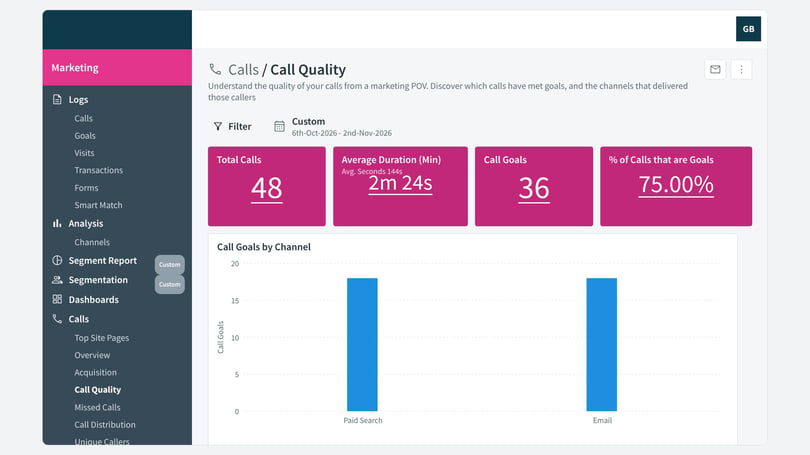
The Call Quality report shows the average duration of the calls you receive. It is a useful reference when you set goals, which we cover later in this article. The call distribution report shows when calls come in and highlights any missed calls. The acquisition report shows your calls by channel. You can switch individual channels on and off, and view results by hour, day, week or month, depending on the date range you have selected.
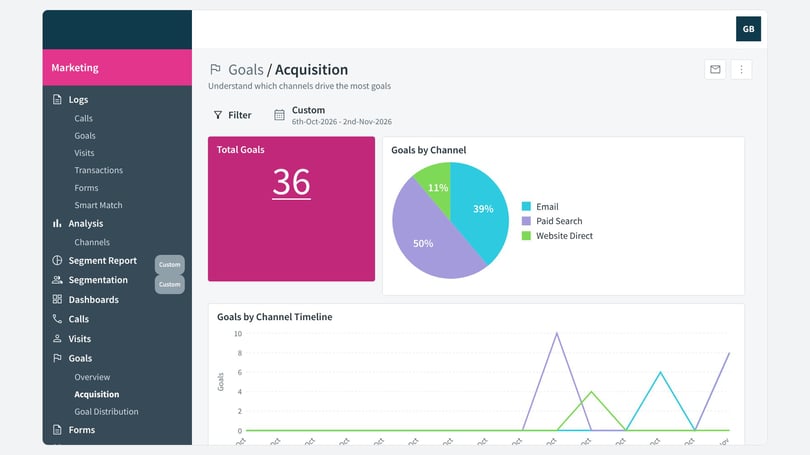
The Goals Overview shows the breakdown of every goal over time, along with the number of unique goals triggered. You can use goals in a similar way to benchmarks. The acquisition report shows which channels have driven the most goals. Wherever you see underlined text, you can select it to see more detail. For example, selecting the number of call goals from paid search takes you to a report showing those goals, including the ones triggered within that channel.
Exporting and scheduled reports
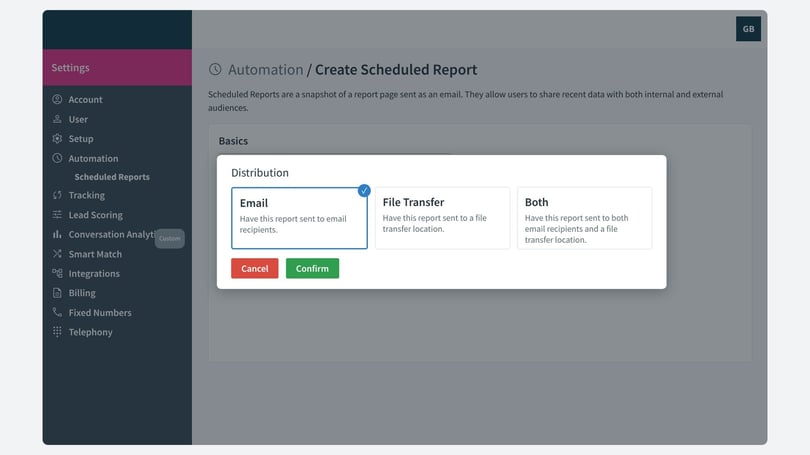
You can export information from any section of the Infinity Platform, in the same way as the rest of your reporting. You can also set up scheduled reports so the data you need is sent automatically to you, your team or anyone else who needs to see it.
To set up a scheduled report, select the mail icon at the top of the screen. You can then name the report, choose the information to include, set how often it is sent, and choose who receives it. You can also decide whether to include personally identifiable information.
Channels
The Infinity Platform lists the default channels available for your installation. The information available within each channel depends on the data you have, but each one gives you a breakdown of how it performs for calls, visits and goals. For example, the paid search channel shows the networks, the best performing campaigns, ad groups and keywords. You can view these in table format or as a timeline. As elsewhere in Infinity, underlined text in blue takes you to more detail.
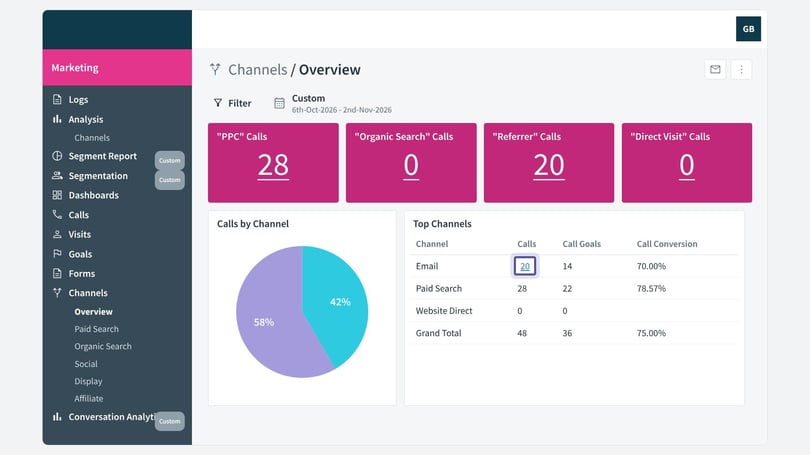
If you have set up and tagged your fixed numbers, the channel data will show which numbers are receiving the most calls. For example, selecting the offline channel shows which numbers are receiving the most calls within that channel.
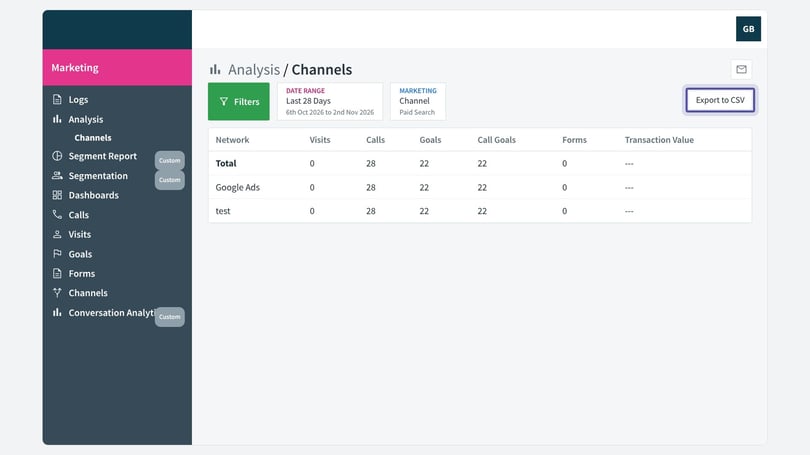
For a closer look at channel performance, the Analysis: Channels reports show results at campaign and keyword level. Use them to see which campaigns, ad groups and keywords are performing best. As with other reports, you can export this information.
Fixed numbers
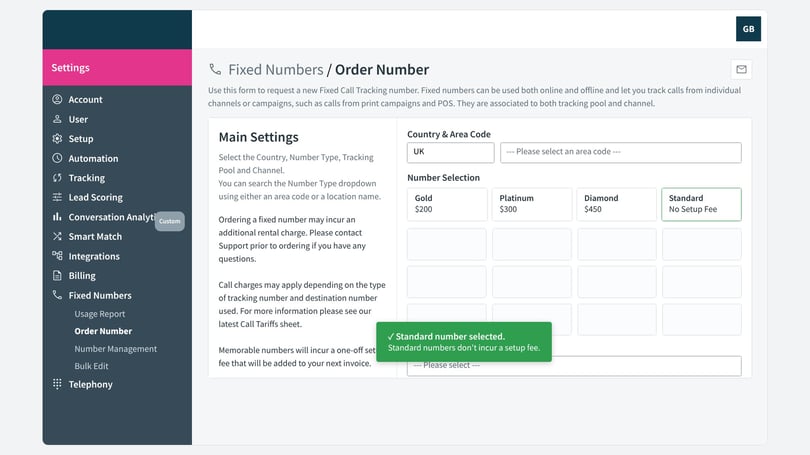
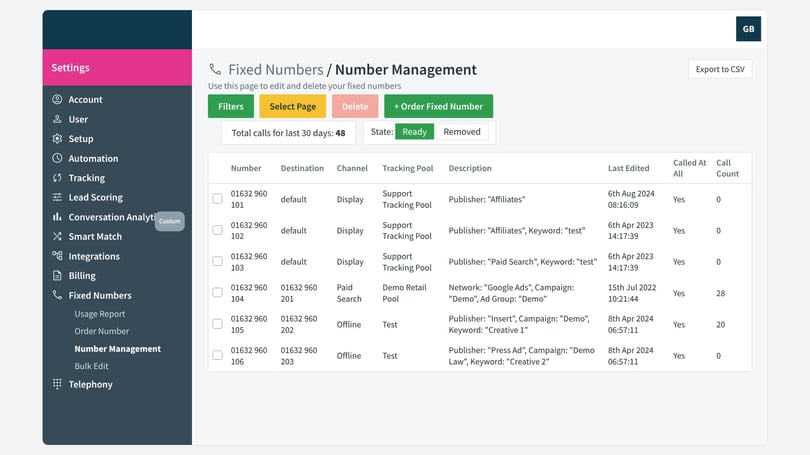
Fixed numbers are self-service. You can order, amend and manage them directly from the Infinity Platform. We have a range of how-to videos on the Campus that walk you through each step of ordering a fixed number.
Managing your installation
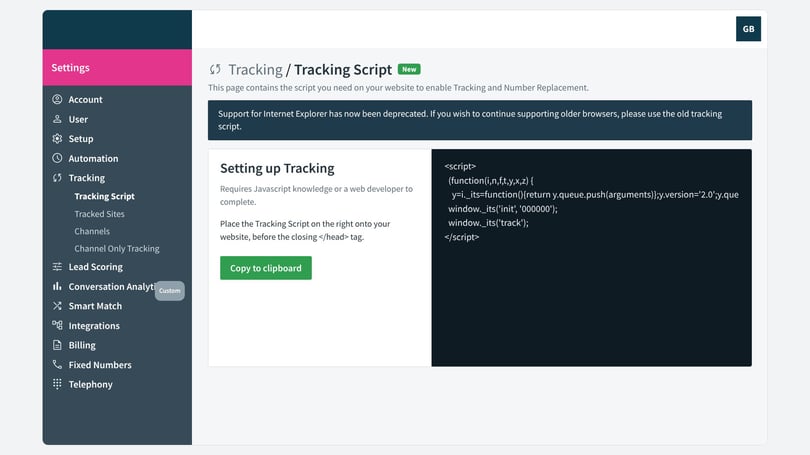
You can manage your installation from Settings, which you will find at the bottom of the navigation sidebar. From here, you can order, manage and monitor your fixed numbers through Setup. You can also manage your JavaScript, create and manage channels and goals, and set up our many out-of-the-box integrations.
Next steps with the Infinity Platform
The Infinity Platform gives you a broad range of insight into your marketing, enabling you to understand how your organisation is performing both online and offline. To learn more, visit the Campus, where you will find articles and videos to help you get the most from the Infinity Platform and optimise your installation.
Need more help?
To set up and report on goals, see the Goals overview, and for dashboards, see Infinity Platform dashboard reporting. If you're still stuck, get in touch with your account team or email support@infinity.co.