In short
- Infinity Platform dashboard reporting shows call data as charts and tables, including the Missed calls, Unique callers and Fixed vs dynamic calls dashboards.
- You can filter an Infinity Platform dashboard with the Filter button or by selecting a value in a widget, which filters every widget on the page until you select Clear Selection.
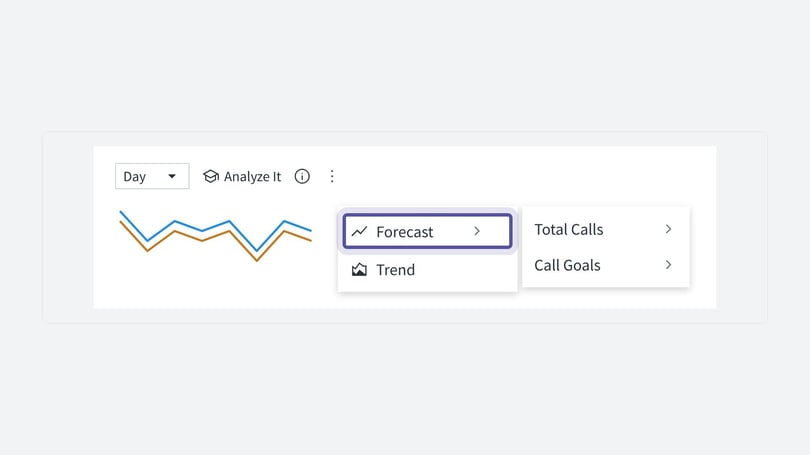
- Trend lines, date comparison and forecasts in Infinity Platform dashboards are set from a widget by selecting Analyze it, then Trend Settings or Forecast.
- Infinity Pulse alerts watch a single value on any dashboard and use either a Threshold condition you set or an Automatic condition that uses machine learning to spot anomalies.
- Set up an Infinity Pulse alert from a widget's three dots menu with Add to Pulse, and manage alerts under Settings > Automation > Scheduled Reports > Manage your dashboard notifications.
Infinity Platform dashboard reporting shows your call data as charts and tables. This guide explains each dashboard, how to filter and drill down into your data, how to add trend lines and forecasts, and how to set up Pulse alerts so you hear about significant changes.
Missed calls dashboard
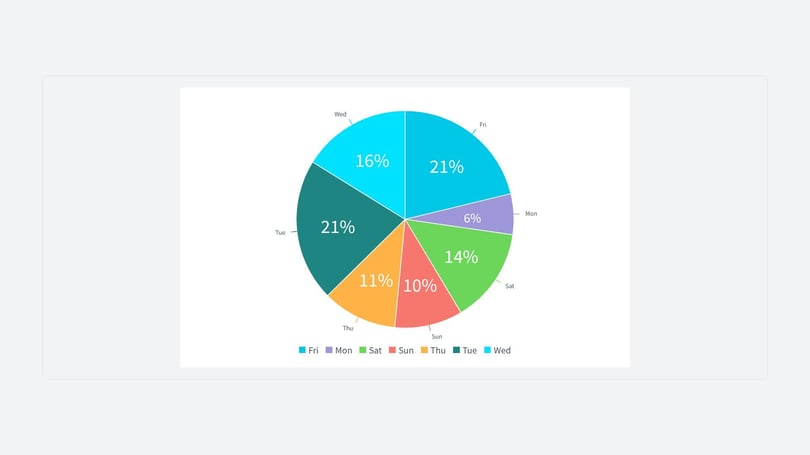
Dashboard reporting starts with the Missed calls dashboard, which shows how efficiently calls are being handled and where you could improve. It has been updated with more colours and widgets. You can see missed and connected calls by channel, time of day, day of the week and tracking pool. If you have segmentation set up, you can also see missed calls by segment.

Unique callers dashboard
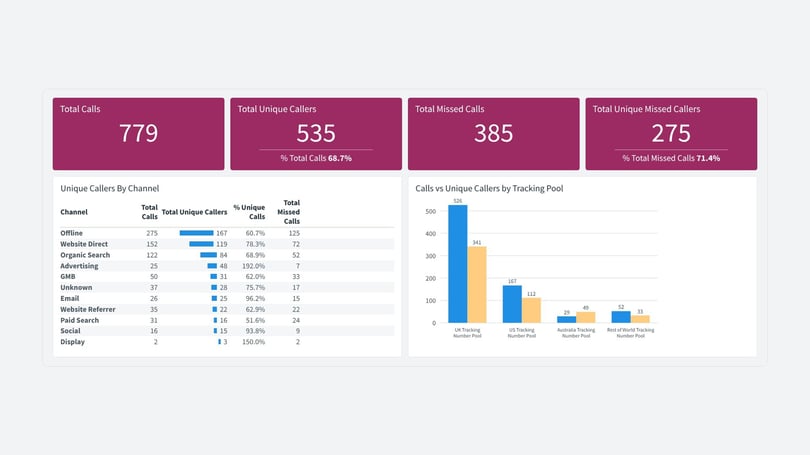
The Unique callers dashboard shows the difference between unique callers and total calls. Use it to:
- Identify trends among frequent callers
- Optimise your marketing strategies
- Improve customer experience by understanding caller patterns and engagement
Fixed vs dynamic calls dashboard
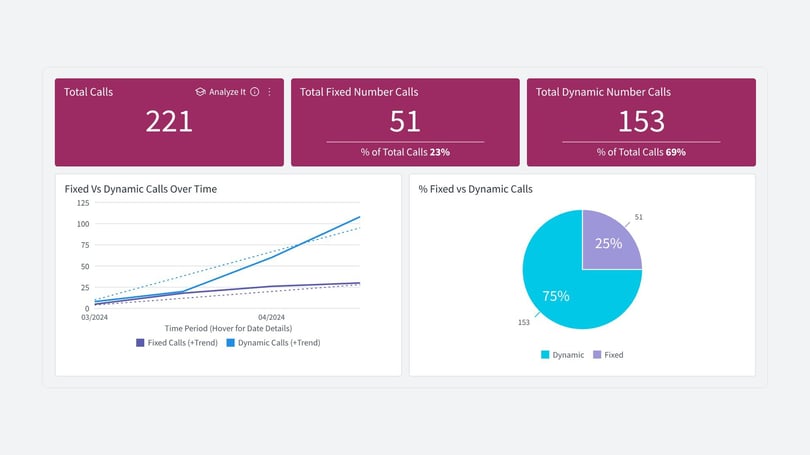
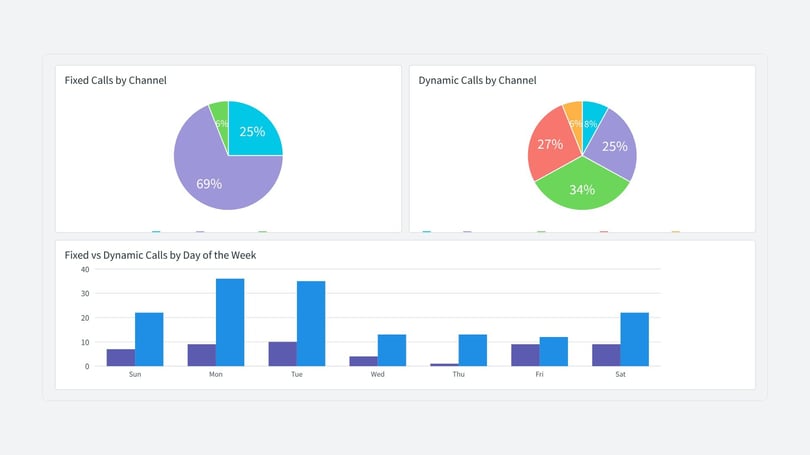
This dashboard lets you report on call types in isolation. You can see your total calls in the Infinity Platform. Within this dashboard you can identify how many of these calls come from your dynamic numbers (visible to visitors on your website), compared with calls to your fixed numbers (typically used for off-website marketing, such as print media, PPC ad extensions and Google My Business).
You can view fixed vs dynamic calls by channel, by tracking pool and by day of the week, and view trends over time using the timeline widget.
Data bars
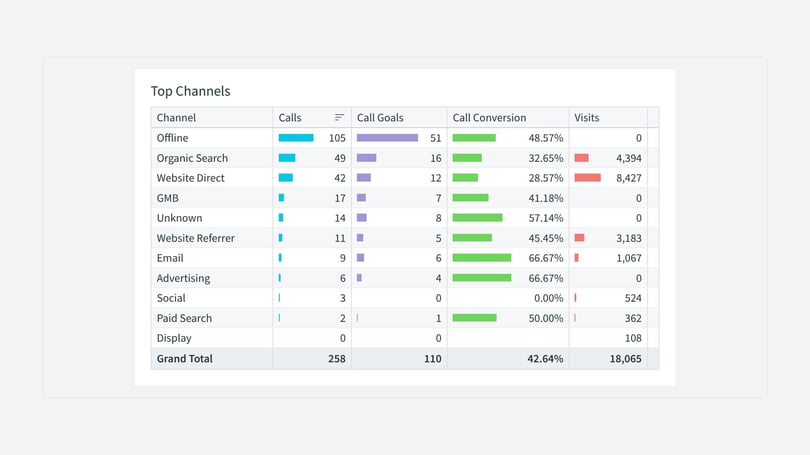
The coloured data bars give a proportional view of all the data in a table. You can pick out the biggest or smallest values by bar size, or spot a pattern. This visual display helps you analyse and interpret the results, such as how many calls led to a goal.
Navigating and filtering
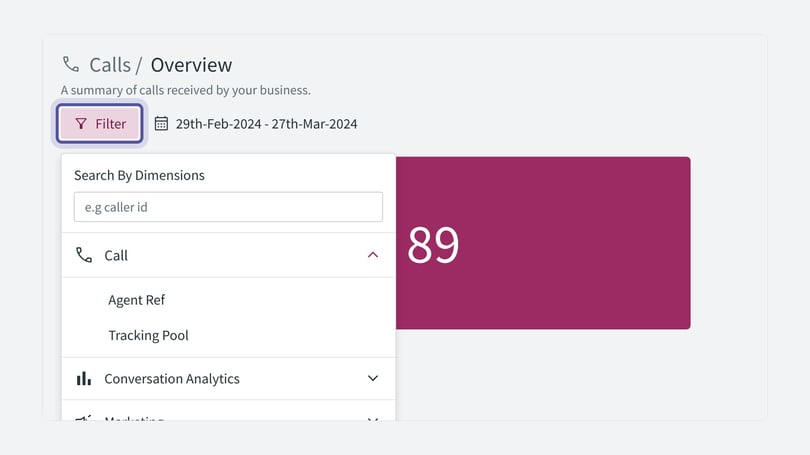
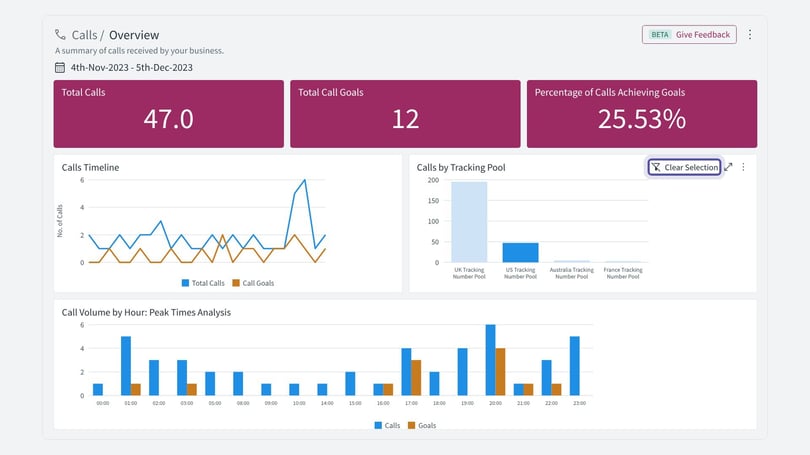
You can filter a dashboard by selecting the Filter button, or by selecting one of the values in a widget. When you select a single value, the filter applies to that widget and to all the others on the page, so everything focuses on the data you have selected. This lets you view specific data in isolation. Select Clear Selection to remove the filter.
Trend lines in dashboard reporting
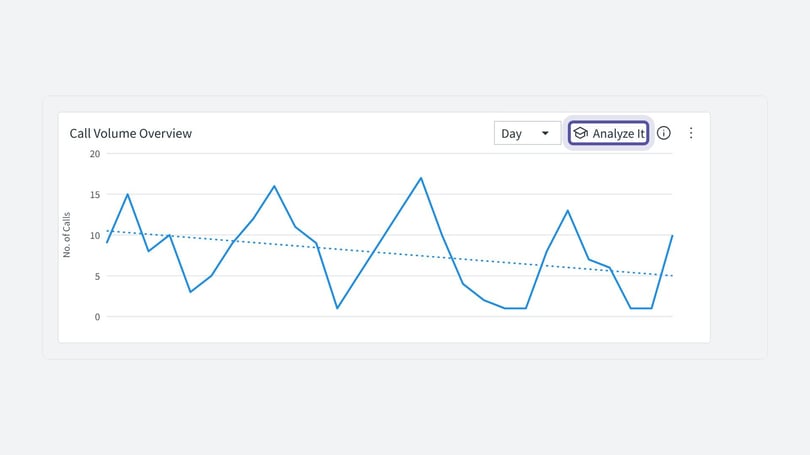
Each widget on your dashboard can include a trend line over the data, to help you see what is happening over time. For example, you can see whether your calls are increasing or decreasing over your chosen date range, and compare calls, goals and visits.
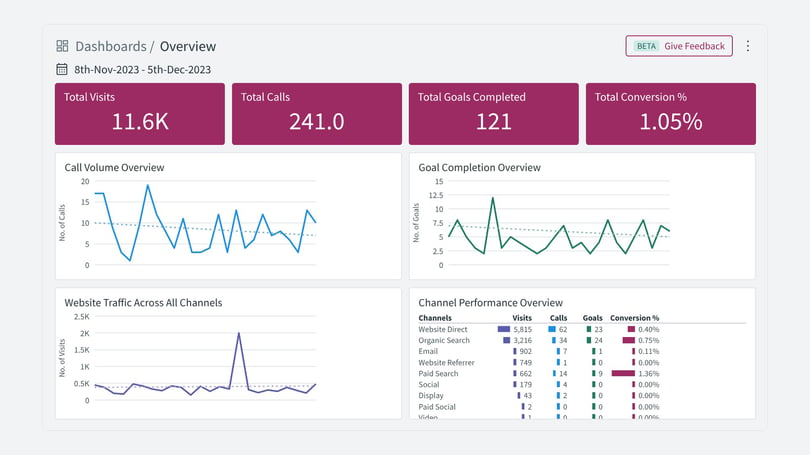
To change the date range, select the date range at the top of your dashboard. The trend line adjusts to include the new data.
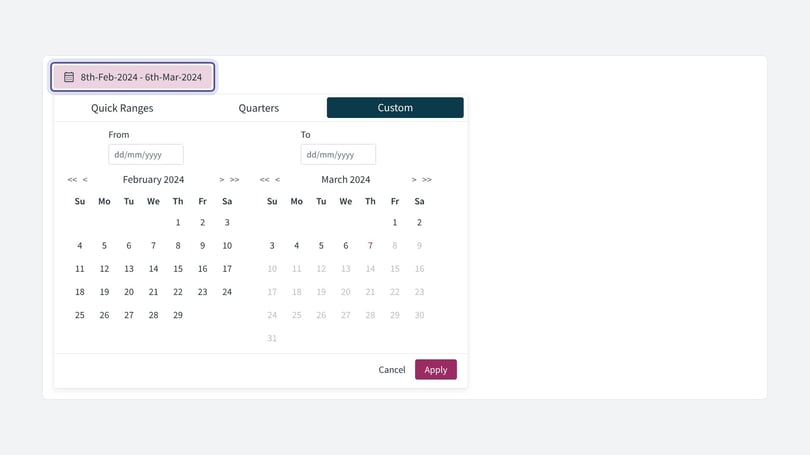
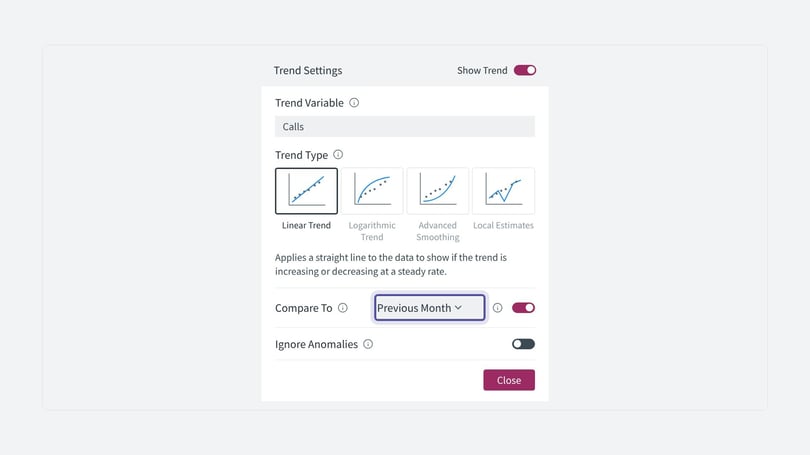
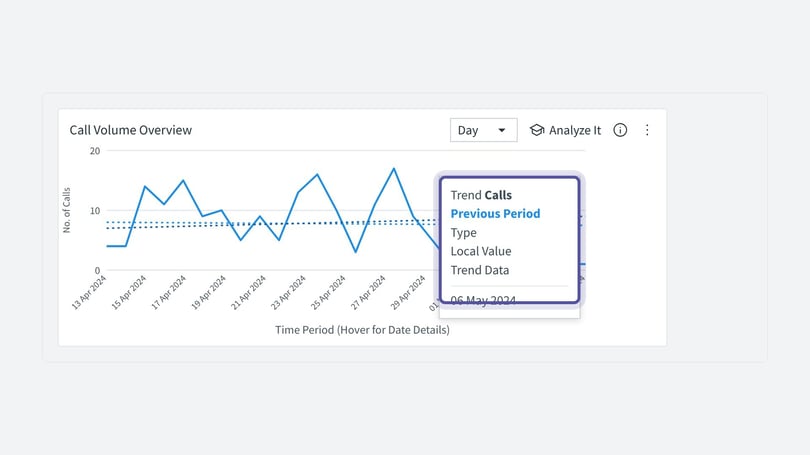
Date comparison lets you compare the trend with previous months, quarters or years. You can use it to analyse seasonal variations and detect possible anomalies. This helps you improve forecasting and make better, evidence-led decisions. To set up date comparison for your trend lines:
- Hover over your chosen widget.
- Select Analyze it.
- Select Trend Settings.
- Choose your trend type and the time period you would like to compare.
- Hover over the current trend to compare it with the previous period trend.
Drill down
The drill down feature is another way to explore your dashboard reporting. It lets you dive into the data directly from a widget. You can build hierarchies to create a path for people to follow. In the example below, a pie chart is segmented by day of the week. Right-click and select Drill into to see the next level down, which in this example is channel.
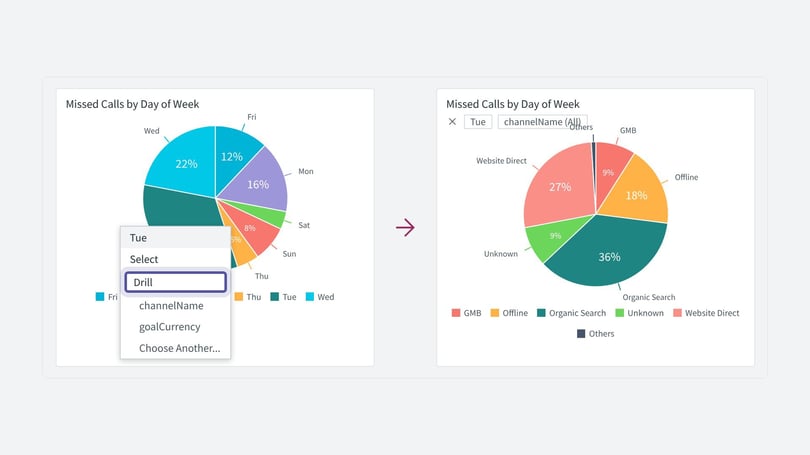
As you select into the data, a breadcrumb appears to keep track of what you have done and where you are. To return to the top level of the path, select the X.
Pulse alerts
Pulse alerts add to your dashboard reporting. You can set up alerts to keep an eye on significant movements, such as monthly revenue, a spike in calls, and marketing channel performance. You set your own parameters for when you want to receive alerts, and you can tailor alerts for changes across all Infinity Platform dashboards, including your own custom dashboards. Each Pulse alert keeps an eye on a single value in your data.
There are two alert conditions:
- Threshold: you are alerted when a value falls within a range you set. For example, alert me if my call volumes drop below 500.
- Automatic: this option uses machine learning to understand your data patterns and alert you to anomalies. It keeps learning from your data, so it alerts you to significant changes.
To set up a Pulse alert:
- Choose the widget (data set) on your dashboard that you would like a Pulse alert for.
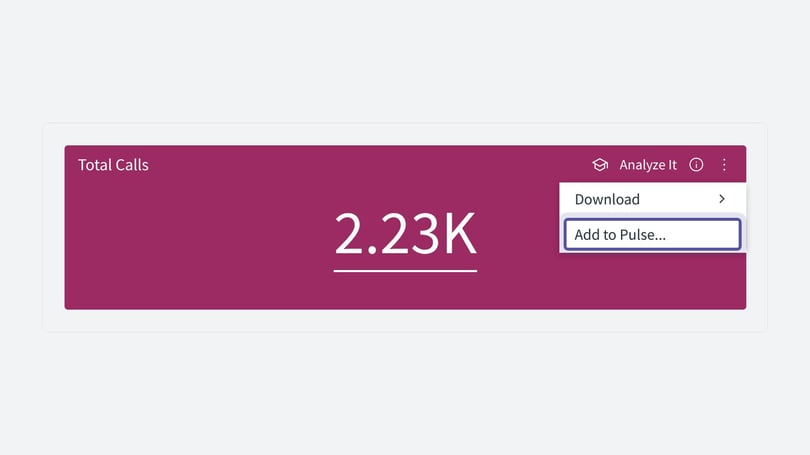
- Hover over the widget and select the three dots at the top right.
- Select Add to Pulse.
- Give your alert a name, and choose Threshold or Automatic.
- Select the alert frequency. This is how often the dashboard checks for the alert.
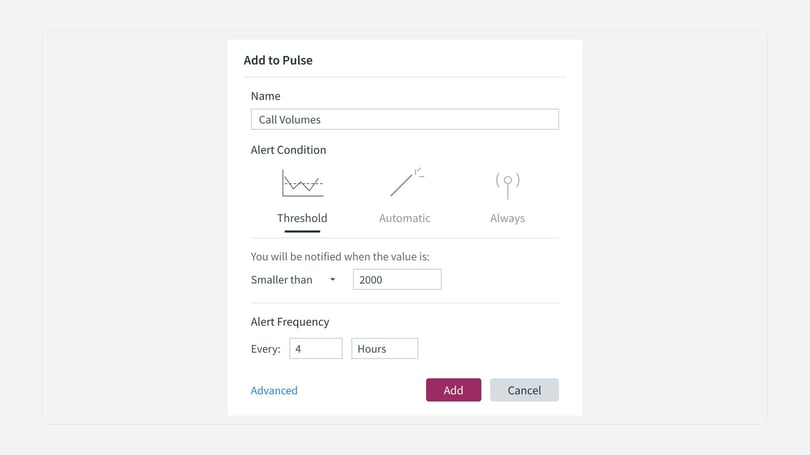
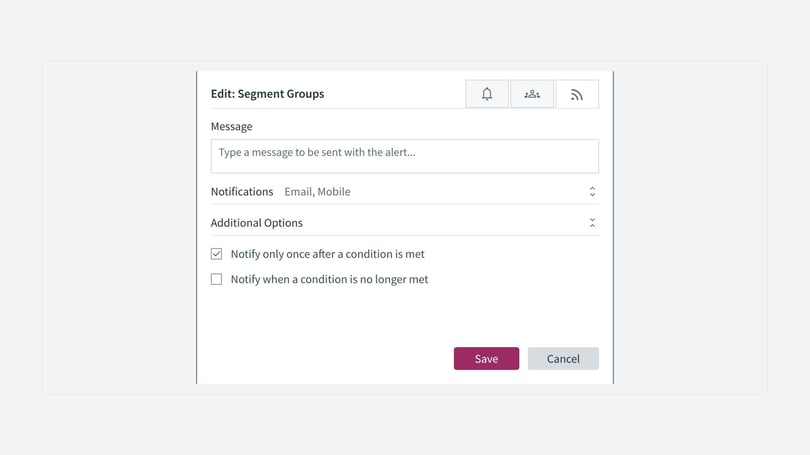
Once you have set the alert condition and frequency, add your email address and select Email. You can give the alert a name and write a message to send with it.
You can find all of your alerts in Settings:
- Select Settings at the bottom left of the Infinity Platform.
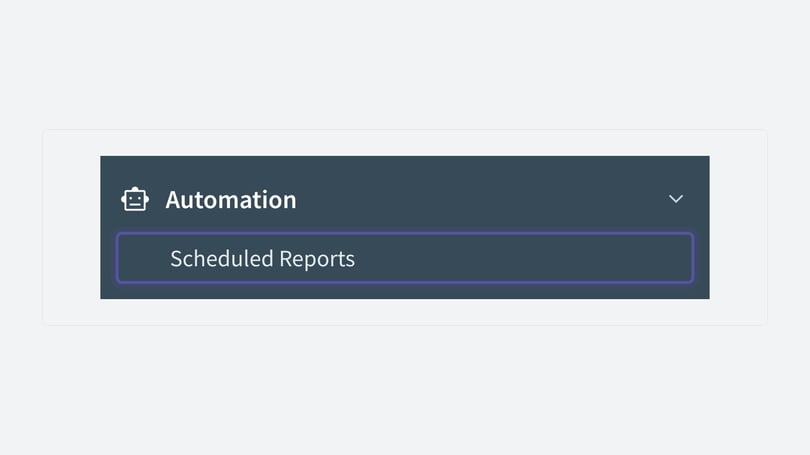
- Go to Automation, then Scheduled Reports.
- Select Manage your dashboard notifications.
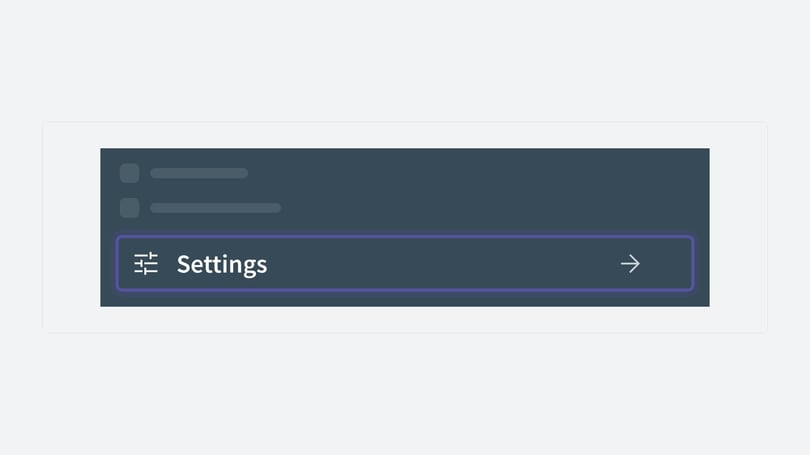
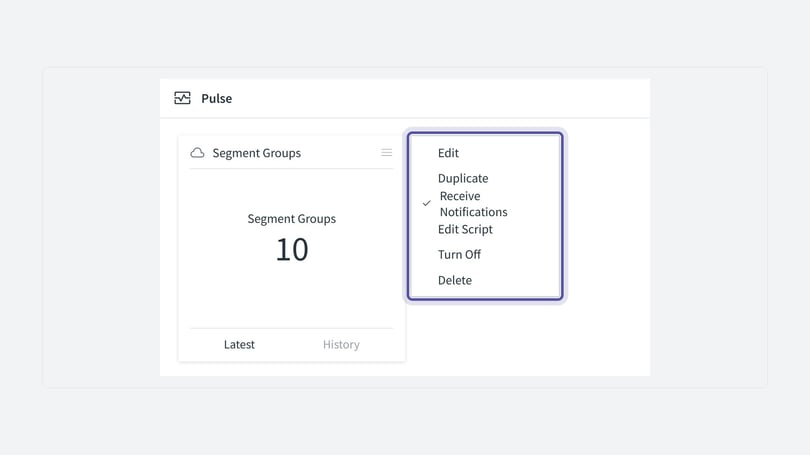
Alerts you have set up appear on the Pulse page. You can edit, turn off and duplicate them quickly. By describing the type of change you want to track, Pulse alerts can give you early warning of it happening.
Forecasting
Forecasting is part of dashboard reporting. It predicts future values based on your historical data, so you can anticipate future trends. The flexible forecast settings let you change a parameter and see how it affects future values. This helps you understand which scenario will support planning, budgeting, campaign optimisation and predicting market demand.
In the Infinity Platform you can see the forecast in your timeline widgets, for example the calls timeline below:
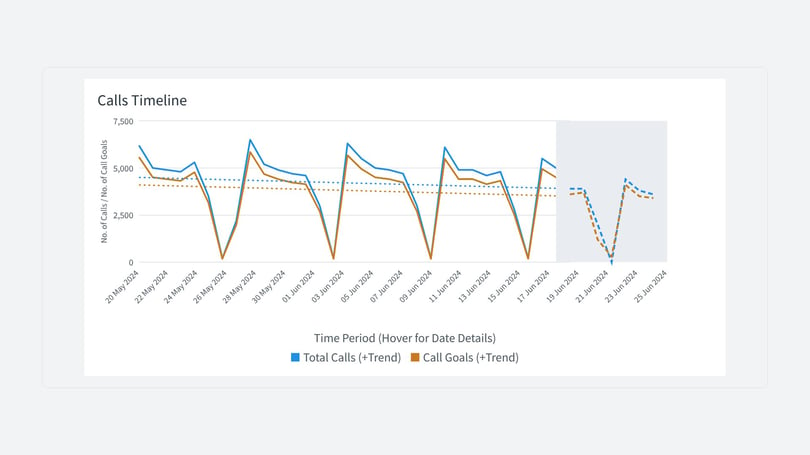
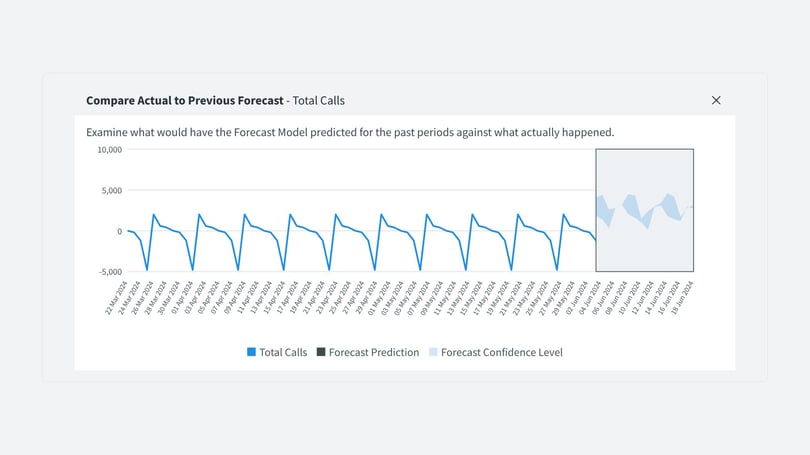
From the widget, select Analyze it, then Forecast to see more information and settings. Depending on the date range you have set, you can view actual against forecasted data. This compares the predicted forecast with what actually happened.
What's next
We will keep improving dashboard reporting and adding new dashboards soon. You can toggle between the classic dashboards and the new dashboards if you wish, using the button in the top right of the Infinity Platform when you are viewing these dashboards. We would really appreciate your feedback on what you have seen so far. You can give it from your Infinity Platform dashboard.